
My RDKit Cheatsheet
Published:
Cheatsheet for RDKit package in python: (1) Draw molecules in jupyter enviroment; (2) use with Pandas Dataframe (3) Descriptors/Fingerprints and (4) Similarity Search etc.
Installation
The RDKit pacakge only supports conda installation.
conda -c rdkit rdkit
Setup
import rdkit
from rdkit import Chem
from rdkit.Chem import AllChem

from rdkit.Chem import Draw
from rdkit.Chem.Draw import IPythonConsole

rdkit.__version__
'2020.03.1'
Chem vs. AllChem
As mentioned in the Getting Started:
The majority of “basic” chemical functionality (e.g. reading/writing molecules, substructure searching, molecular cleanup, etc.) is in the
rdkit.Chemmodule. More advanced, or less frequently used, functionality is inrdkit.Chem.AllChem.
If you find the Chem/AllChem thing annoying or confusing, you can use python’s “import … as …” syntax to remove the irritation:
from rdkit.Chem import AllChem as Chem
Basic
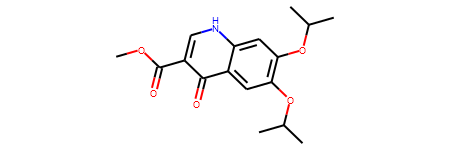
Get a RDKit molecule from SMILES. RDKit molecule enable several features to handle molecules: drawing, computing fingerprints/properties, molecular curation etc.
smiles = 'COC(=O)c1c[nH]c2cc(OC(C)C)c(OC(C)C)cc2c1=O'
mol = Chem.MolFromSmiles(smiles)
print(mol)
<rdkit.Chem.rdchem.Mol object at 0x000001F84A4CEE90>
The RDKit molecules can be directly printed in jupyter enviroment.
mol
Convert a RDKit molecule to SMILES.
smi = Chem.MolToSmiles(mol)
smi
'COC(=O)c1c[nH]c2cc(OC(C)C)c(OC(C)C)cc2c1=O'
Convert a RDKit molecule to InchiKey.
Chem.MolToInchiKey(mol)
'VSIUFPQOEIKNCY-UHFFFAOYSA-N'
Convert a RDKit molecule to coordinative representation (which can be stored in .sdf file).
mol_block = Chem.MolToMolBlock(mol)
print(mol_block)
     RDKit          2D

 23 24  0  0  0  0  0  0  0  0999 V2000
    5.2500   -1.2990    0.0000 C   0  0  0  0  0  0  0  0  0  0  0  0
    3.7500   -1.2990    0.0000 O   0  0  0  0  0  0  0  0  0  0  0  0
    3.0000    0.0000    0.0000 C   0  0  0  0  0  0  0  0  0  0  0  0
    3.7500    1.2990    0.0000 O   0  0  0  0  0  0  0  0  0  0  0  0
    1.5000    0.0000    0.0000 C   0  0  0  0  0  0  0  0  0  0  0  0
    0.7500   -1.2990    0.0000 C   0  0  0  0  0  0  0  0  0  0  0  0
   -0.7500   -1.2990    0.0000 N   0  0  0  0  0  0  0  0  0  0  0  0
   -1.5000    0.0000    0.0000 C   0  0  0  0  0  0  0  0  0  0  0  0
   -3.0000    0.0000    0.0000 C   0  0  0  0  0  0  0  0  0  0  0  0
   -3.7500    1.2990    0.0000 C   0  0  0  0  0  0  0  0  0  0  0  0
   -5.2500    1.2990    0.0000 O   0  0  0  0  0  0  0  0  0  0  0  0
   -6.0000    0.0000    0.0000 C   0  0  0  0  0  0  0  0  0  0  0  0
   -7.5000    0.0000    0.0000 C   0  0  0  0  0  0  0  0  0  0  0  0
   -5.2500   -1.2990    0.0000 C   0  0  0  0  0  0  0  0  0  0  0  0
   -3.0000    2.5981    0.0000 C   0  0  0  0  0  0  0  0  0  0  0  0
   -3.7500    3.8971    0.0000 O   0  0  0  0  0  0  0  0  0  0  0  0
   -3.0000    5.1962    0.0000 C   0  0  0  0  0  0  0  0  0  0  0  0
   -3.7500    6.4952    0.0000 C   0  0  0  0  0  0  0  0  0  0  0  0
   -1.5000    5.1962    0.0000 C   0  0  0  0  0  0  0  0  0  0  0  0
   -1.5000    2.5981    0.0000 C   0  0  0  0  0  0  0  0  0  0  0  0
   -0.7500    1.2990    0.0000 C   0  0  0  0  0  0  0  0  0  0  0  0
    0.7500    1.2990    0.0000 C   0  0  0  0  0  0  0  0  0  0  0  0
    1.5000    2.5981    0.0000 O   0  0  0  0  0  0  0  0  0  0  0  0
  1  2  1  0
  2  3  1  0
  3  4  2  0
  3  5  1  0
  5  6  2  0
  6  7  1  0
  7  8  1  0
  8  9  2  0
  9 10  1  0
 10 11  1  0
 11 12  1  0
 12 13  1  0
 12 14  1  0
 10 15  2  0
 15 16  1  0
 16 17  1  0
 17 18  1  0
 17 19  1  0
 15 20  1  0
 20 21  2  0
 21 22  1  0
 22 23  2  0
 22  5  1  0
 21  8  1  0
M  END
Reading sets of molecules
Major types of molecular file formats:
.csvfile that includes a column ofSMILES. SeePandasToolssection..smi/.txtfile that includesSMILES. Collect the SMILES as a list. The following code is an example to read a.smifile that contains one SMILES per line.
file_name = 'somedata.smi'

with open(file_name, "r") as ins:
    smiles = []
    for line in ins:
        smiles.append(line.split('\n')[0])
print('# of SMILES:', len(smiles))
.sdffile that includesatom coordinates. Reading molecules from.sdffile. Code Example
Draw molecules in Jupter environment
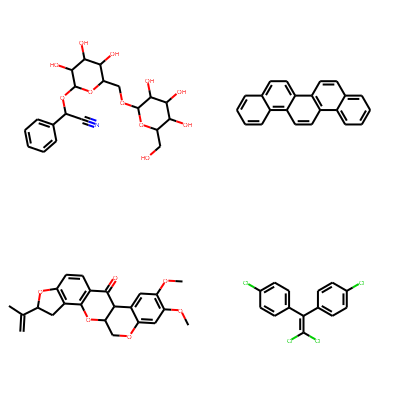
Print molecules in grid.
smiles = [
    'N#CC(OC1OC(COC2OC(CO)C(O)C(O)C2O)C(O)C(O)C1O)c1ccccc1',
    'c1ccc2c(c1)ccc1c2ccc2c3ccccc3ccc21',
    'C=C(C)C1Cc2c(ccc3c2OC2COc4cc(OC)c(OC)cc4C2C3=O)O1',
    'ClC(Cl)=C(c1ccc(Cl)cc1)c1ccc(Cl)cc1'
]

mols = [Chem.MolFromSmiles(smi) for smi in smiles]
Draw.MolsToGridImage(mols, molsPerRow=2, subImgSize=(200, 200))
PandasTools
PandasTools enables using RDKit molecules as columns of a Pandas Dataframe.
import pandas as pd
from rdkit.Chem import PandasTools
url = 'https://raw.githubusercontent.com/XinhaoLi74/molds/master/clean_data/ESOL.csv'

esol_data = pd.read_csv(url)
esol_data.head(1)
| smiles | logSolubility | |
|---|---|---|
| 0 | N#CC(OC1OC(COC2OC(CO)C(O)C(O)C2O)C(O)C(O)C1O)c... | -0.77 |
Add ROMol to Pandas Dataframe.
PandasTools.AddMoleculeColumnToFrame(esol_data, smilesCol='smiles')
esol_data.head(1)
| smiles | logSolubility | ROMol | |
|---|---|---|---|
| 0 | N#CC(OC1OC(COC2OC(CO)C(O)C(O)C2O)C(O)C(O)C1O)c... | -0.77 |  |
ROMol column stores rdchem.Mol object.
print(type(esol_data.ROMol[0]))
<class 'rdkit.Chem.rdchem.Mol'>
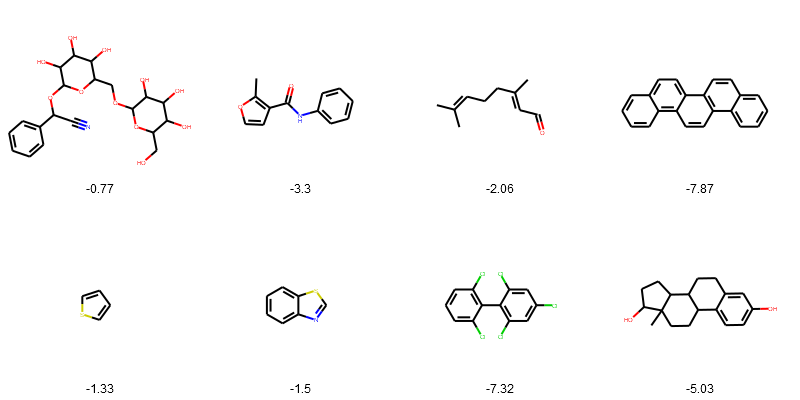
Draw the structures in grid.
PandasTools.FrameToGridImage(esol_data.head(8), legendsCol="logSolubility", molsPerRow=4)
Adding new columns of properites use Pandas map method.
esol_data["n_Atoms"] = esol_data['ROMol'].map(lambda x: x.GetNumAtoms())
esol_data.head(1)
| smiles | logSolubility | ROMol | n_Atoms | |
|---|---|---|---|---|
| 0 | N#CC(OC1OC(COC2OC(CO)C(O)C(O)C2O)C(O)C(O)C1O)c... | -0.77 | | 32 |
Before saving the dataframe as csv file, it is recommanded to drop the ROMol column.
esol_data = esol_data.drop(['ROMol'], axis=1)
esol_data.head(1)
| smiles | logSolubility | n_Atoms | |
|---|---|---|---|
| 0 | N#CC(OC1OC(COC2OC(CO)C(O)C(O)C2O)C(O)C(O)C1O)c... | -0.77 | 32 |
Descriptors/Fingerprints
The RDKit has avariety of built-in functionality for generating molecular fingerprints/descriptors. A detialed description can be found here.
url = 'https://raw.githubusercontent.com/XinhaoLi74/molds/master/clean_data/ESOL.csv'

esol_data = pd.read_csv(url)
PandasTools.AddMoleculeColumnToFrame(esol_data, smilesCol='smiles')
esol_data.head(1)
| smiles | logSolubility | ROMol | |
|---|---|---|---|
| 0 | N#CC(OC1OC(COC2OC(CO)C(O)C(O)C2O)C(O)C(O)C1O)c... | -0.77 | |
Morgan Fingerprint (ECFPx)
AllChem.GetMorganFingerprintAsBitVect Parameters:
radius: no default value, usually set 2 for similarity search and 3 for machine learning.nBits: number of bits, default is 2048. 1024 is also widely used.- other parameterss are ususlly left to default
More examples can be found in this notebook from my previous work.
radius=3
nBits=1024

ECFP6 = [AllChem.GetMorganFingerprintAsBitVect(x,radius=radius, nBits=nBits) for x in esol_data['ROMol']]
ECFP6[0]
<rdkit.DataStructs.cDataStructs.ExplicitBitVect at 0x1f84e70f4e0>
ECFP6 fingerprint for each molecule has 1024 bits.
len(ECFP6[0])
1024
Save as a .csv file for futher use (e.g., machine learning). I usually save (1) SMILES as index and (2) each bit as a column to the csv file.
ecfp6_name = [f'Bit_{i}' for i in range(nBits)]
ecfp6_bits = [list(l) for l in ECFP6]
df_morgan = pd.DataFrame(ecfp6_bits, index = esol_data.smiles, columns=ecfp6_name)
df_morgan.head(1)
| Bit_0 | Bit_1 | Bit_2 | Bit_3 | Bit_4 | Bit_5 | Bit_6 | Bit_7 | Bit_8 | Bit_9 | ... | Bit_1014 | Bit_1015 | Bit_1016 | Bit_1017 | Bit_1018 | Bit_1019 | Bit_1020 | Bit_1021 | Bit_1022 | Bit_1023 | |
|---|---|---|---|---|---|---|---|---|---|---|---|---|---|---|---|---|---|---|---|---|---|
| smiles | |||||||||||||||||||||
| N#CC(OC1OC(COC2OC(CO)C(O)C(O)C2O)C(O)C(O)C1O)c1ccccc1 | 0 | 1 | 0 | 0 | 1 | 0 | 0 | 0 | 0 | 0 | ... | 0 | 0 | 0 | 0 | 0 | 1 | 0 | 0 | 0 | 0 |
1 rows × 1024 columns
Similarity Search
Compute the similarity of a reference molecule and a list of molecules. Here is an example of using ECFP4 fingerprint to compute the Tanimoto Similarity (the default metric of DataStructs.FingerprintSimilarity.
- compute fingerprints
ref_smiles = 'COC(=O)c1c[nH]c2cc(OC(C)C)c(OC(C)C)cc2c1=O'
ref_mol = Chem.MolFromSmiles(ref_smiles)
ref_ECFP4_fps = AllChem.GetMorganFingerprintAsBitVect(ref_mol,2)
ref_mol

bulk_ECFP4_fps = [AllChem.GetMorganFingerprintAsBitVect(x,2) for x in esol_data['ROMol']]
from rdkit import DataStructs

similarity_efcp4 = [DataStructs.FingerprintSimilarity(ref_ECFP4_fps,x) for x in bulk_ECFP4_fps]
We can also add the similarity_efcp4 to the dataframe and visualize the structure and similarity.
esol_data['Tanimoto_Similarity (ECFP4)'] = similarity_efcp4
PandasTools.FrameToGridImage(esol_data.head(8), legendsCol="Tanimoto_Similarity (ECFP4)", molsPerRow=4)
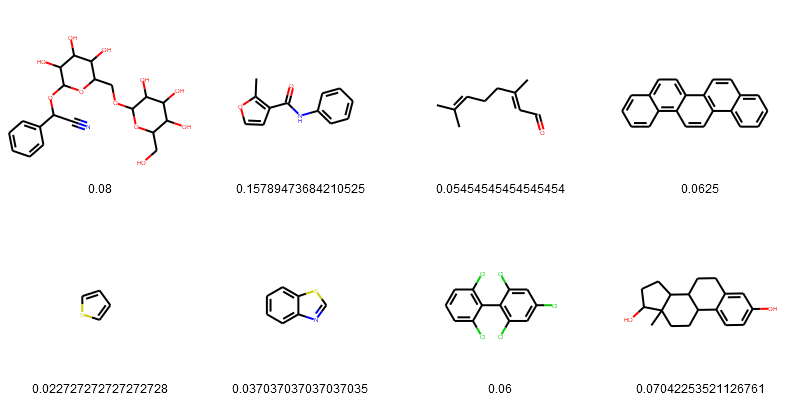
Sort the result from highest to lowest.
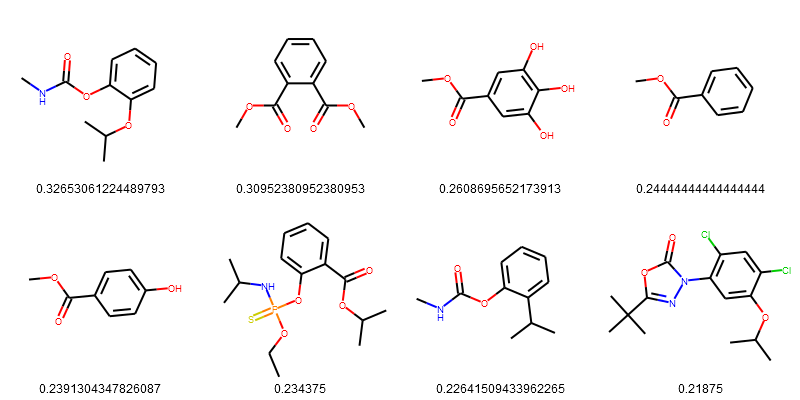
esol_data = esol_data.sort_values(['Tanimoto_Similarity (ECFP4)'], ascending=False)
PandasTools.FrameToGridImage(esol_data.head(8), legendsCol="Tanimoto_Similarity (ECFP4)", molsPerRow=4)
More Reading
- Offical documentation.
- Getting Started with the RDKit in Python
- The RDKit Book
- RDKit Cookbook
This document provides example recipes of how to carry out particular tasks using the RDKit functionality from Python. The contents have been contributed by the RDKit community, tested with the latest RDKit release, and then compiled into this document.
Leave a Comment